Creating palettes of colours in R
Tom Webb 7/12/09 v1.0
R is renowned for its graphical capabilities, whether you're after crisp, simple plots or very complex, nuanced images. This is great if, like me, you believe that the statistical graphics in your work should be produced with at least as much care and attention as any text you write. I highly recommend spending a bit of time, then, learning how to customise R's graphical output - a good place to start finding out how to do this is Paul Murrell's book 'R Graphics', which has loads of useful code on the website. Also, for inspiration it's worth a look at the R Graph Gallery.
However, there is one aspect of graphical presentation that is relatively straightforward, but which can take a lot of fiddling to find out about: flexible use of colour. But when you're producing complex - maybe multidimensional - plots, or just brightening up your graphics for a presentation, it can be really useful to generate a palette of colours. R provides several ways to do this.
pre-loaded palettes
Pre-loaded in R you have functions such as rainbow(), heat.colors(), and grey() which allow you to create various standard palettes. For instance, the command:
rainbow(n = 10)will create a nice 10-colour palette, graded through the spectrum from red to indigo. To see, try:
plot(1:10, 1:10, cex = 5, pch = 16, col = rainbow(10))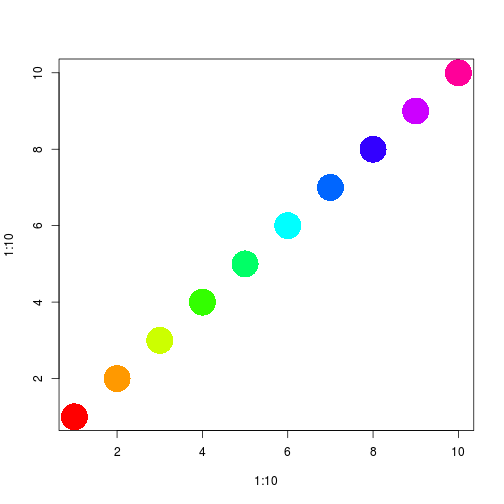
I find I often want to stop at blue, for maximum contrast, which you can do by specifying start and end points of the spectrum:
plot(1:10, 1:10, cex = 5, pch = 16, col = rainbow(10, start = 0, end = 2/3))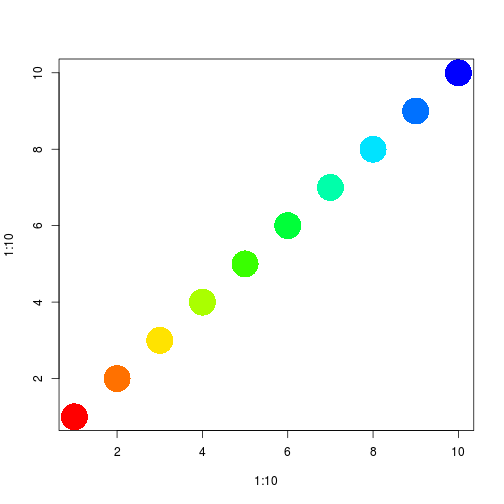
semi-transparent colours
Sometimes, you might want shapes to overlap, and still be visible. Semi-transparent colours are useful then; these can be specified using the ‘alpha’ argument in most of the palette functions, for example:
plot(1:10, 1:10, cex = 15, pch = 16, col = rainbow(10, start = 0, end = 2/3,
    alpha = 0.5), xpd = TRUE)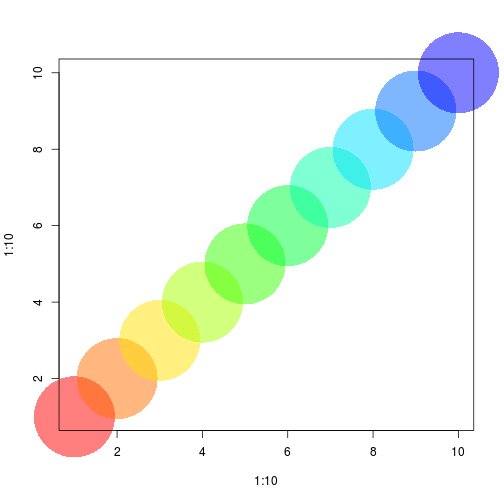
(Note the argument ```xpd = TRUE, which allows symbols to be drawn outside of the plotting area – not always desirable, but a useful trick to know.)
If you examine the vectors of hexadecimal colour codes generated when you vary alpha, you can get an idea of how to change the transparency of individual colours, so
rainbow(10, start = 0, end = 2/3, alpha = 0.5)gives
"#FF000080" "#FF710080" "#FFE30080" "#AAFF0080" "#39FF0080" "#00FF3980" "#00FFAA80" "#00E3FF80" "#0071FF80" "#0000FF80"whereas
rainbow(10, start = 0, end = 2/3, alpha = 1)gives
"#FF0000FF" "#FF7100FF" "#FFE300FF" "#AAFF00FF" "#39FF00FF" "#00FF39FF" "#00FFAAFF" "#00E3FFFF" "#0071FFFF" "#0000FFFF"So you can see that it is the final two characters that are important. This is useful because some functions do not accept an alpha argument. In particular, for greyscale palettes there is no alpha control, you simply specify a vector of grey levels you want. Grey varies from 0 (black) to 1 (white), so
grey(0:10 / 10)will give you 10 shades of grey between black and white.
But if you examine the actual colours, you’ll notice there are no alpha characters:
"#000000" "#1A1A1A" "#333333" "#4D4D4D" "#666666" "#808080" "#999999" "#B3B3B3" "#CCCCCC" "#E6E6E6" "#FFFFFF"So if you want semi-transparent greys, you need to manipulate these strings a bit. Here’s my solution. First, just look at the grey palette
pal <- grey(0:10/10)
plot(1:10, 1:10, cex = 15, pch = 16, col = pal)
Now, add an alpha code, for instance, 80 to correspond to alpha = 0.5
pal <- paste(pal, 80, sep = "")
plot(1:10, 1:10, cex = 15, pch = 16, col = pal)
other palette functions
Finally, there are some other useful functions in other packages for generating palettes. The function intpalette() in the shape package is great, for example. It allows you a lot of control over the palette, by specifying your starting and ending colours in a very intuitive manner. For instance:
library(shape)
pal <- intpalette(c("white", "red"), numcol = 10)
will give you a 10 colour palette grading from white to red
plot(1:10, 1:10, cex = 15, pch = 16, col = pal)
What's great though is that you can specify intermediate colours too. For temperature, say, you might want to grade from white to red via yellow, like this:
plot(1:10, 1:10, cex = 15, pch = 16, col = intpalette(c("white", "yellow", "red"),
    numcol = 10))
And there's no limit to the number of intermediate steps you request (as long as you have more points than colours!)
plot(1:10, 1:10, cex = 15, pch = 16, col = intpalette(c("white", "lightyellow",
    "yellow", "red"), numcol = 10))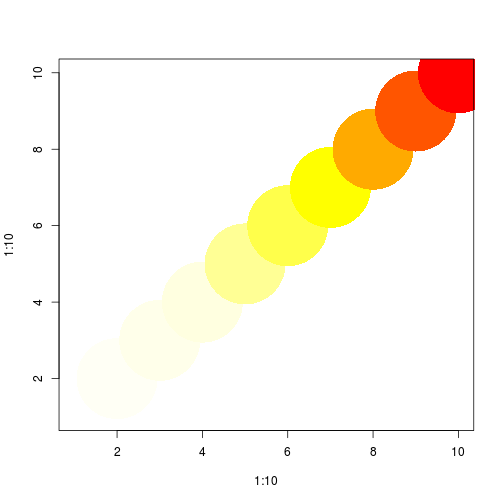
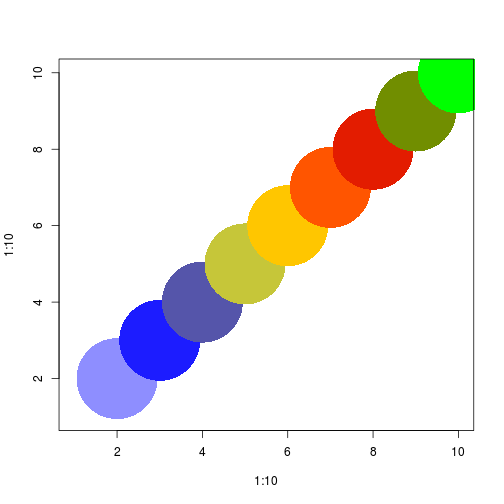
Even weird, ugly combinations are perfectly possible...
plot(1:10, 1:10, cex = 15, pch = 16, col = intpalette(c("white", "blue", "yellow",
    "red", "green"), numcol = 10))